RSS

October sales exceed historical average

Metro Vancouver home sales exceeded typical historical levels in October with the majority concentrated in the townhouse and apartment markets.


The Real Estate Board of Greater Vancouver (REBGV) reports that residential property sales in the region totalled 3,022 in October 2017, a 35.3 per cent increase from the 2,233 sales recorded in October 2016, and an increase of 7.1 per cent compared to September 2017 when 2,821 homes sold.


Last month’s sales were 15 per cent above the 10-year October sales average.


“Conditions continue to vary significantly based on property type. The detached home market is well supplied with homes for sale, which is relieving pressure on prices,” Jill Oudil, REBGV president said. “It remains a much different story in the townhouse and apartment markets. Buyers of these properties continue to have limited supply to choose from and are seeing upward pressure on prices.”


There were 4,539 detached, attached and apartment properties newly listed for sale on the Multiple Listing Service® (MLS®) in Metro Vancouver in October 2017. This represents a 14 per cent increase compared to the 3,981 homes listed in October 2016 and a 15.6 per cent decrease compared to September 2017 when 5,375 homes were listed.


The total number of properties currently listed for sale on the MLS® system in Metro Vancouver is 9,137, a 0.1 per cent decrease compared to October 2016 (9,143) and a 3.5 per cent decrease compared to September 2017 (9,466).

For all property types, the sales-to-active listings ratio for October 2017 is 33.1 per cent. By property type, the ratio is 16.8 per cent for detached homes, 44.8 per cent for townhomes, and 66 per cent for condominiums.


Generally, analysts say that downward pressure on home prices occurs when the ratio dips below the 12 per cent mark for a sustained period, while home prices often experience upward pressure when it surpasses 20 per cent over several months.“The growth in our provincial economy and job market is contributing to today’s demand,” Oudil said. “The federal government’s announcement of plans to tighten mortgage requirements for the seventh time in the last eight years also helped spur activity in the short term. Many buyers are trying to enter the market before the changes are in place.”


The MLS® Home Price Index composite benchmark price for all residential properties in Metro Vancouver is currently $1,042,300. This represents a 12.4 per cent increase over October 2016 and a 0.5 per cent increase compared to September 2017.


Sales of detached properties in October 2017 reached 940, a 44.2 per cent increase from the 652 detached sales recorded in October 2016 and a 34.6 per cent decrease from the 1,437 sales in October 2015. The benchmark price for detached properties is $1,609,600. This represents a four per cent increase from October 2016 and a 0.5 per cent decrease compared to September 2017.


Sales of apartment properties reached 1,532 in October 2017, a 30.1 per cent increase compared to the 1,178 sales in October 2016 and a 0.7 per cent decrease from the 1,543 sales in October 2015. The benchmark price of an apartment property is $642,000. This represents a 22.7 per cent increase from October 2016 and a one per cent increase compared to September 2017.


Attached property sales in October 2017 totalled 550, a 36.5 per cent increase compared to the 403 sales in October 2016 and a 17.4 per cent decrease from the 666 sales in October 2015. The benchmark price of an attached unit is $802,400. This represents a 17.7 per cent increase from October 2016 and a two per cent increase compared to September 2017.


Source: Real Estate Board of Greater Vancouver

Read

Condominiums and townhomes in high demand across Metro Vancouver

Demand for condominiums and townhomes continues to drive the Metro Vancouver* housing market.

Residential property sales in the region totalled 3,553 in April 2017, a 25.7 per cent decline compared to April 2016 when 4,781 homes sold and a 0.7 per cent decrease from the 3,579 sales recorded in March 2017.

April sales were 4.8 per cent above the 10-year average for the month.


For the first four months of the year, condominium and townhome sales have comprised a larger percentage of all residential sales on the Multiple Listing Service® (MLS®) in Metro Vancouver. Over this time, they’ve accounted for 68.5 per cent, on average, of all residential sales. This is up 10 per cent from the 58.2 per cent average over the same period last year.


“Our overall market is operating below the record-setting pace from a year ago and is in line with historical spring levels. It’s a different story in our condominium and townhome markets," Jill Oudil, Real Estate Board of Greater Vancouver (REBGV) president said. “Demand has been increasing for months and supply is not keeping pace. This dynamic is causing prices to increase and making multiple offer scenarios the norm.”


New listings for detached, attached and apartment properties in Metro Vancouver totalled 4,907 in April 2017. This represents a decrease of 19.9 per cent compared to the 6,127 units listed in April 2016 and a three per cent increase compared to March 2017 when 4,762 properties were listed.


The total number of residential properties currently listed for sale on the MLS® system in Metro Vancouver is 7,813, a 3.5 per cent increase compared to April 2016 (7,550) and a three per cent increase compared to March 2017 (7,586).


The sales-to-active listings ratio for April 2017 is 45.5 per cent for all property types. This is two per cent below March 2017 and is indicative of a sellers’ market. Generally, analysts say that downward pressure on home prices occurs when the ratio dips below the 12 per cent mark for a sustained period, while home prices often experience upward pressure when it surpasses 20 per cent over several months.


By property type, the sales-to-active listings ratio is 26 per cent for detached homes, 58.2 per cent for townhomes, and 82.2 per cent for condominiums. “Until more entry level, or ‘missing middle’, homes are available for sale in our market, we’ll likely continue to see prices increase,” Oudil said. “There’s been record building this past year, but much of that inventory isn’t ready to hit the market.”


The MLS® Home Price Index composite benchmark price for all residential properties in Metro Vancouver is currently $941,100. This represents a five per cent increase over the past three months and an 11.4 per cent increase compared to April 2016.


Over the last three months, the benchmark price of condominiums has seen the largest increase in the region at 8.2 per cent, followed by townhomes at 5.3 per cent, and detached homes at 2.8 per cent. “Home buyers are looking to get into the market and they’re facing fierce competition,” Oudil said. “It’s important to work with your local Realtor to help you navigate today’s marketplace.”


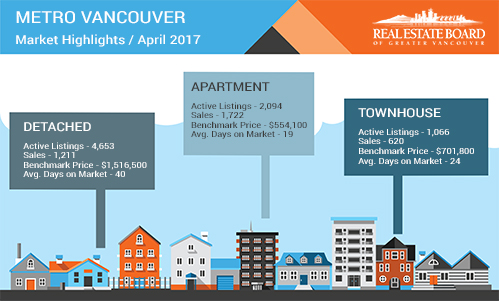
Sales of detached properties in April 2017 reached 1,211, a decrease of 38.8 per cent from the 1,979 detached sales recorded in April 2016. The benchmark price for detached properties is $1,516,500. This represents an 8.1 per cent increase over the last 12 months and a 1.8 per cent increase compared to March 2017.


Sales of apartment, or condominium, properties reached 1,722 in April 2017, a decrease of 18.3 per cent compared to the 2,107 sales in April 2016.The benchmark price of an apartment property is $554,100. This represents a 16.6 per cent increase over the past 12 months and a 3.1 per cent increase compared to March 2017.


Attached, or townhome, property sales in April 2017 totalled 620, a decrease of 10.8 per cent compared to the 695 sales in April 2016. The benchmark price of an attached unit is $701,800. This represents a 15.3 per cent increase over the past 12 months and a 2.4 per cent increase compared to March 2017.


source: Real Estate Board of Greater Vancouver

Read

March 2017 - Demand for homes continues to outpace supply in Metro Vancouver!

A shortage of residential property listings coupled with strong demand, particularly for condos and townhomes, continued to impact Metro Vancouver’s housing market in March.


Residential property sales in the region totalled 3,579 in March 2017, a decrease of 30.8 per cent from the 5,173 sales recorded in record-breaking March 2016 and an increase of 47.6 per cent compared to February 2017 when 2,425 homes sold.


Last month’s sales were 7.9 per cent above the 10-year sales average for the month.


“While demand in March was below the record high of last year, we saw demand increase month-to-month for condos and townhomes,” Jill Oudil, Real Estate Board of Greater Vancouver (REBGV) president said. “Sellers still seem reluctant to put their homes on the market, making for stiff competition among home buyers.”


New listings for detached, attached and apartment properties in Metro Vancouver totalled 4,762 in March 2017. This represents a decrease of 24.1 per cent compared to the 6,278 units listed in March 2016 and a 29.9 per cent increase compared to February 2017 when 3,666 properties were listed.

This is the lowest number of new listings in March since 2009.


The total number of properties currently listed for sale on the MLS® system in Metro Vancouver is 7,586, a 3.1 per cent increase compared to March 2016 (7,358) and a 0.1 per cent decrease compared to February 2017 (7,594).

The sales-to-active listings ratio for March 2017 is 47.2 per cent, a 15-point increase over February.


Generally, analysts say that downward pressure on home prices occurs when the ratio dips below the 12 per cent mark for a sustained period, while home prices often experience upward pressure when it surpasses 20 per cent over several months.


“Home prices will likely continue to increase until we see more housing supply coming on to the market,” Oudil said.


The MLS® Home Price Index composite benchmark price for all residential properties in Metro Vancouver is currently $919,300. This represents a 0.8 per cent decrease over the past six months and a 1.4 per cent increase compared to February 2017.


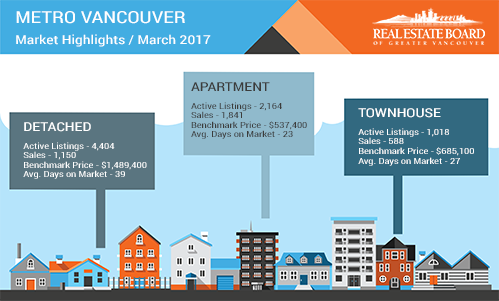
Sales of detached properties in March 2017 reached 1,150, a decrease of 46.1 per cent from the 2,135 detached sales recorded in March 2016. The benchmark price for detached properties is $1,489,400. This represents a 5.0 per cent decrease over the past six months and a one per cent increase compared to February 2017.


Sales of apartment properties reached 1,841 in March 2017, a decrease of 18.3 per cent compared to the 2,252 sales in March 2016.The benchmark price of an apartment property is $537,400. This represents a 5.2 per cent increase over the past six months and a 2.1 per cent increase compared to February 2017.


Attached property sales in March 2017 totalled 588, a decrease of 25.2 per cent compared to the 786 sales in March 2016. The benchmark price of an attached unit is $685,100. This represents a 1.3 per cent increase over the past six months and a 1.4 per cent increase compared to February 2017.


source: Real Estate Board of Greater Vancouver

Read

VANCOUVER, BC – March 2, 2017 – Reluctance amongst Metro Vancouver* home sellers is impacting sale and price activity throughout the region’s housing market. Residential home sales in the region totalled 2,425 in February 2017. This is a 41.9 per cent decrease from the record 4,172 homes sold in February 2016 and an increase of 59.2 per cent compared to January 2017 when 1,523 homes sold.


Last month’s sales were 7.7 per cent below the 10-year February sales average.


“February home sales were well below the record-breaking activity from one year ago and in line with our long-term historical average for the month,” Dan Morrison, Real Estate Board of Greater Vancouver (REBGV) president said. “Limited supply and snowy weather were two factors hampering this activity.”


New listings for detached, attached and apartment properties in Metro Vancouver totalled 3,666 in February 2017. This represents a 36.9 per cent decrease compared to the 5,812 units listed in February 2016 and an 11.4 per cent decrease compared to January 2017 when 4,140 properties were listed.


This is the lowest number of new listings registered in February since 2003.


The total number of properties currently listed for sale on the Multiple Listing Service® (MLS®) in Metro Vancouver is 7,594, a four per cent increase compared to February 2016 (7,299) and a 4.9 per cent increase compared to January 2017 (7,238). The region’s sales-to-active listings ratio for February 2017 is 31.9 per cent, a 10-point increase from January. Generally, analysts say that downward pressure on home prices occurs when the ratio dips below the 12 per cent mark for a sustained period, while home prices often experience upward pressure when it surpasses 20 per cent over several months.


“While home sales are not happening at the pace we experienced last year, home seller supply is still struggling to keep up with today’s demand. This is why we’ve seen little downward pressure on home prices, particularly in the condominium and townhome markets,” Morrison said.


The MLS® Home Price Index composite benchmark price for all residential properties in Metro Vancouver is currently $906,700. This represents a 2.8 per cent decrease over the past six months and a 1.2 per cent increase compared to January 2017.


Sales of detached properties in February 2017 reached 745, a decrease of 58.1 per cent from the 1,778 detached sales recorded in February 2016. The benchmark price for detached properties is $1,474,200. This represents a 6.5 per cent decrease over the past six months and is unchanged compared to January 2017.


Sales of apartment properties reached 1,275 in February 2017, a decrease of 28.8 per cent compared to the 1,790 sales in February 2016.The benchmark price of an apartment property is $526,300. This represents a 2.3 per cent increase over the past six months and a 2.7 per cent increase compared to January 2017.


Attached property sales in February 2017 totalled 404, a decrease of 33.1 per cent compared to the 604 sales in February 2016. The benchmark price of an attached unit is $675,500. This represents a 0.3 per cent decrease over the past six months and a 1.3 per cent increase compared to January 2017. 


Source: Real Estate Board of Greater Vancouver

Read

Home sales and listings trends are below long-term averages in the Metro Vancouver* housing market. This is due largely to reduced activity in the detached home market.


Residential property sales in the region totalled 1,523 in January 2017, a 39.5 per cent decrease from the 2,519 sales recorded in January 2016 and an 11.1 per cent decrease compared to December 2016 when 1,714 homes sold.

Last month’s sales were 10.3 per cent below our 10-year January sales average.


“From a real estate perspective, it’s a lukewarm start to the year compared to 2016,” Dan Morrison, Real Estate Board of Greater Vancouver (REBGV) president said. “While we saw near record-breaking sales at this time last year, home buyers and sellers are more reluctant to engage so far in 2017.”


New listings for detached, attached and apartment properties in Metro Vancouver totalled 4,140 in January 2017. This represents a 6.8 per cent decrease compared to the 4,442 homes listed in January 2016 and a 215.5 per cent increase compared to December 2016 when 1,312 properties were listed.


The total number of homes currently listed for sale on the Multiple Listing Service® (MLS®) in Metro Vancouver is 7,238, a 9.1 per cent increase compared to January 2016 (6,635) and a 14.1 per cent increase compared to December 2016 (6,345).


The sales-to-active listings ratio for January 2017 is 21 per cent. This is the lowest the ratio has been in the region since January 2015. Generally, analysts say that downward pressure on home prices occurs when the ratio dips below the 12 per cent mark for a sustained period, while home prices often experience upward pressure when it surpasses 20 per cent over several months.


“Conditions within the market vary depending on property type. The townhome and condominium markets are more active than the detached market at the moment,” Morrison said. “As a result, detached home prices declined about 7 per cent since peaking in July while townhome and condominium prices held steady over this period.”


The MLS® Home Price Index composite benchmark price for all residential properties in Metro Vancouver is currently $896,000. This represents a 3.7 per cent decline over the past six months and a 0.2 per cent decrease compared to December 2016.


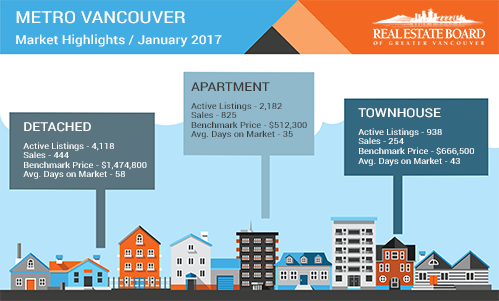
Sales of detached properties in January 2017 reached 444, a decrease of 57.6 per cent from the 1,047 detached sales recorded in January 2016. The benchmark price for detached properties is $1,474,800. This represents a 6.6 per cent decline over the last six months and a 0.6 per cent decrease compared to December 2016.


Sales of apartment properties reached 825 in January 2017, a decrease of 24.7 per cent compared to the 1,096 sales in January 2016.The benchmark price of an apartment property is $512,300. This represents a 0.3 per cent increase over the last six months and a 0.4 per cent increase compared to December 2016.


Attached property sales in January 2017 totalled 254, a decrease of 32.4 per cent compared to the 376 sales in January 2016. The benchmark price of an attached unit is $666,500. This represents a 0.4 per cent decline over the last six months and a 0.7 per cent increase compared to December 2016.


SOURCE: Real Estate Board of Greater Vancouver

Read